Markets seldom provide clear warnings before changing direction. But certain candlestick patterns quietly give hints of a shift in momentum. One of the most reliable of them is the bullish engulfing pattern.
This basic two-candle formation often appears just as the selling pressure is beginning to recede and buyers are starting to come in. It’s easy to miss unless you know what to look for.
In this article, we’ll explain how the bullish engulfing pattern works and how it can help you spot trend reversals ahead of others.
What is a Bullish Engulfing Pattern?
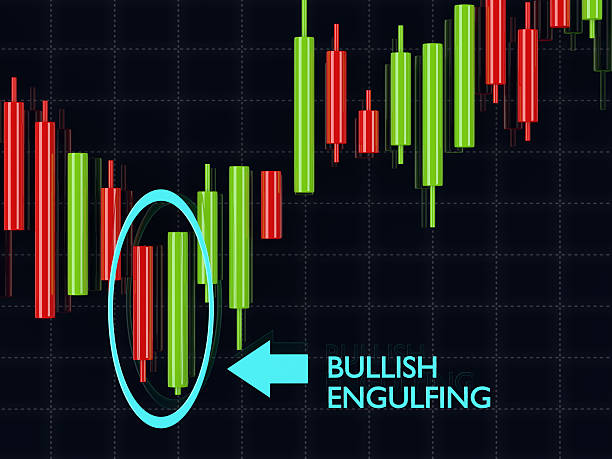
A bullish engulfing pattern is a two-candle pattern that occurs after a downtrend. The first candle is small and red, showing the continued selling.
The second candle opens lower and closes much higher, completely covering the body of the previous candle. This shift implies that buyers have taken control and may push prices up. It is a sign of a potential trend reversal, especially if it is supported by an increase in trading volume.
Traders often use it as a clue in entering long positions in the early stages of a bounce.
Key Characteristics to Identify It
A bullish engulfing pattern is rather simple to detect once you know what to look for. It’s always formed after a downtrend, even if it’s only a short-term decline. The first candle in the pattern is typically a red or bearish candle that indicates that sellers are still in control.
The second candle is the actual signal. It opens lower than the previous day’s close, and so it may appear that the downtrend will persist. But then, buyers step in. By the end of the session, this is a green candle that is closing above the previous candle’s open price. In other words, it totally “engulfs” the red candle before it.
This change in price action indicates that the buyers have suddenly taken charge. The momentum has turned, and this could be the early indication of a trend reversal.
To sum up, here’s how you recognise it:
- It shows up after a decline.
- The second candle opened lower and closed much higher than the first candle.
- The green candle is bigger and goes around the body of the red one.
This pattern doesn’t just reflect price; it indicates a change in mood. When seen in the right context, it often means that the bulls are willing to push back.
Why It Signals a Market Turn?
The bullish engulfing pattern is formed at the end of a downtrend. It tells you that selling pressure may be running out of steam, and buyers are coming into the picture.
When this pattern forms, the second candle completely covers the body of the first red candle. This shift indicates a distinct shift in market sentiment. The first day, the sellers were in control. But on the second day, buyers not only pushed prices higher, but they also closed above the previous day’s opening. This is not a random move. It is indicative of the increasing buyers’ confidence.
This strong bullish action often means that the worst of an event may be over, at least for the short term. It is a hint that there may be a turnaround with the prices, which could now begin to rise.
When backed up by high trading volume or technical indicators such as RSI crossing from oversold levels, the signal becomes even more reliable. Traders use it to get ready for a long position as they expect the market to turn upward from this point.
In simple terms, the bullish engulfing depicts a clear power shift from the sellers to the buyers. And that change is what makes it a reliable indicator of a potential trend change.
How to Trade the Bullish Engulfing Pattern
To trade the bullish engulfing pattern effectively, the first thing you need to confirm is context. It should occur after a clear downtrend or a sustained decline, not in a sideways market. If it’s created during choppy movement, it loses meaning.
Once you identify the pattern, wait for the bullish candle to close. Don’t rush. Entry should ideally occur at the beginning of the next candle, once the engulfing candle is completely formed. This confirms that buyers have taken control.
Set your stop-loss just below the low of the bullish engulfing candle. This ensures you in case the trend doesn’t reverse as expected.
Before going in, try to confirm the pattern with another indicator. For example:
- Check if the volume is increasing during the bullish candle.
- Look at RSI or MACD to see if momentum is in support of the shift.
This pattern can be much more meaningful when it occurs at a support zone or near previous price lows. That’s where buyer interest is often stronger.
Also, be on the lookout for conflicting signals. For example, if the shooting star pattern appears just above your entry, you might get a heads-up that upward momentum is weakening. That’s a possible indicator to exit or tighten your stop.
Conclusion
The bullish engulfing pattern is a strong visual signal that buyers are stepping in after a decline. It helps traders to identify potential reversals with confidence. When used with proper confirmation, this pattern can improve timing and decision-making in the market, especially for those watching for early trend changes.